
ROAS vs MER vs POAS: which number should run your ad budget?
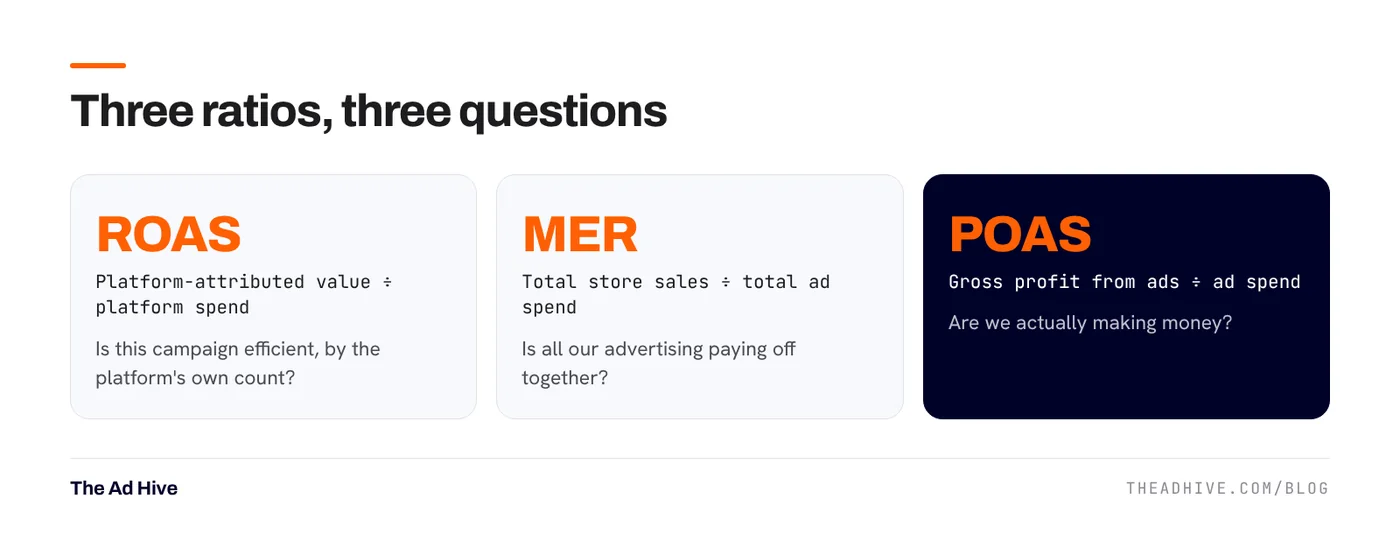
ROAS tells you what a platform claims. MER tells you what the business got. POAS tells you whether you made money. You need all three, used for different decisions.
Key takeaways
- ROAS (return on ad spend) is platform-reported. Each platform counts its own credit, so totals overlap.
- MER (marketing efficiency ratio) is total store sales ÷ total ad spend. Nobody can double count it.
- POAS (profit on ad spend) puts margin into the picture. It tells you if ads make money.
- Define “sales” before using any of them: order value minus discounts, labelled incl. or excl. returns.
We often meet brands where Google reports a 5× ROAS, Meta reports 4×, and the bank account says the business is barely breaking even. Nobody is lying. They’re just using different numbers for different jobs, and mixing them up.
Start by defining “sales”
Before any ratio, agree what sales means. Our rule on every account:
- Gross sales = order value − discounts. The customer never paid the discount, so it isn’t revenue.
- Label every figure “incl. returns” or “excl. returns”. Never leave it unclear.
- Never mix bases. Don’t put gross and net, or incl. and excl. returns, in one table or one claim.
Example: an order lists ₹4,000 of products with a ₹500 coupon. Gross sales is ₹3,500. If that order is later returned, it counts in “incl. returns” and drops out of “excl. returns”.
ROAS: the platform’s view
ROAS = conversion value ÷ ad spend. Google writes it as a percentage (500% means ₹5 back per ₹1). Amazon uses the inverse, ACOS.
What ROAS is good for:
- Comparing campaigns, ad sets and products inside one platform.
- Steering Smart Bidding and Advantage+. Our Target ROAS guide covers how to set targets.
What it’s bad at:
- Overlap. A buyer who clicks a Meta ad and later a Google ad can be counted by both.
- Returns. Platform value includes orders later returned or cancelled.
- Window changes. Meta removed 7-day and 28-day view windows from its API in January 2026, which changed many reports. See our Meta attribution guide.
MER: the business view
MER = total store sales ÷ total ad spend (all platforms, same dates).
Worked example for one month:
| Line | Amount |
|---|---|
| Store gross sales (after discounts, excl. returns) | ₹30,00,000 |
| Google Ads spend | ₹4,00,000 |
| Meta Ads spend | ₹4,00,000 |
| Total ad spend | ₹8,00,000 |
| MER | 3.75 |
If Google claims ₹20,00,000 and Meta claims ₹16,00,000, platforms claim ₹36,00,000 in total, more than the store actually sold. That is overlap in action, and why MER keeps everyone honest.
MER’s weakness: it includes sales that would have happened without ads, like repeat buyers and word of mouth. Use it to set total budget, not to judge one campaign.
POAS: the profit view
POAS = gross profit from ad-driven sales ÷ ad spend. Gross profit here means sales minus product cost, shipping, payment fees and expected returns.
Example: a ₹2,000 order with 45% gross margin earns ₹900 gross profit. If ads cost ₹600 to get it, POAS is 1.5. Above 1.0 the ad spend is covered by the profit on that order. Below 1.0 you lose money on the first order and need repeat purchases to recover it.
POAS is the most honest number, but it needs product-level margin data. Many brands start by tagging products into margin bands with custom labels in their Shopping feed.
Which number for which decision
| Decision | Use |
|---|---|
| Which campaign or creative to scale | ROAS, plus new-customer share |
| How much to spend in total next month | MER |
| Whether a product line should be advertised at all | POAS |
| Bid targets | Break-even from margin, applied as ROAS |
| Amazon | ACOS per campaign, TACoS for the whole account |
On Amazon, the same logic applies with different names. See ACOS vs TACoS.
When platform and store numbers disagree, don’t silently choose one. Find out why: attribution windows, cancellations, exchanges, returns or time zones. The gap itself tells you something.
Getting these numbers straight is part of every forensic PPC audit we run and every monthly report in our PPC management. For broader growth planning, see our e-commerce consulting.
Frequently asked questions
What is a good MER for an e-commerce brand?
It depends on your margins and repeat rate. Work out the MER at which total ad spend still leaves the profit you need, using your gross margin after product, shipping and payment costs. That number is your floor.
Why is my ROAS higher than my MER?
Each platform claims credit using its own attribution, so the same sale can be counted by Google and Meta. Platform value also includes orders later returned or cancelled. MER uses actual store sales, so it is usually lower.
Should sales figures include returns?
State it either way, every time. Gross sales should be order value minus discounts. Then label each figure as including or excluding returns, and never compare the two bases in the same table.
Sources
- Google Ads Help: About Target ROAS bidding
- Amazon Ads: ACOS, advertising cost of sales
- Meta for Developers: Ads Insights API metric availability updates
Sources checked on 15 November 2026. Platform features change often; check the linked pages for the latest details.
Want this done on your account?
We manage Google and Meta ads for e-commerce, D2C and lead-gen brands. Every engagement starts with a manual review of what is already running.
Related guides

Target ROAS bidding: how to set it, when to change it, and the mistakes that kill volume
Target ROAS is the bid strategy most e-commerce accounts end up on. Set it from your margins, move it slowly, and judge it on more than…
Meta attribution in 2026: what changed and how to read your results
In January 2026 Meta removed two view-through windows from its reporting API and shortened some historical data. If your Meta numbers suddenly look different from old…

ACOS vs TACoS on Amazon: how to read them and set targets
ACOS tells you how efficient your Amazon ads are. TACoS tells you whether they're growing the business. Read them together and you'll know when to push…